 Mortise Apps
Velocity report
Last updated 2026-09-30
Completed versus committed work per team over the last closed sprints, across every board in the scope.
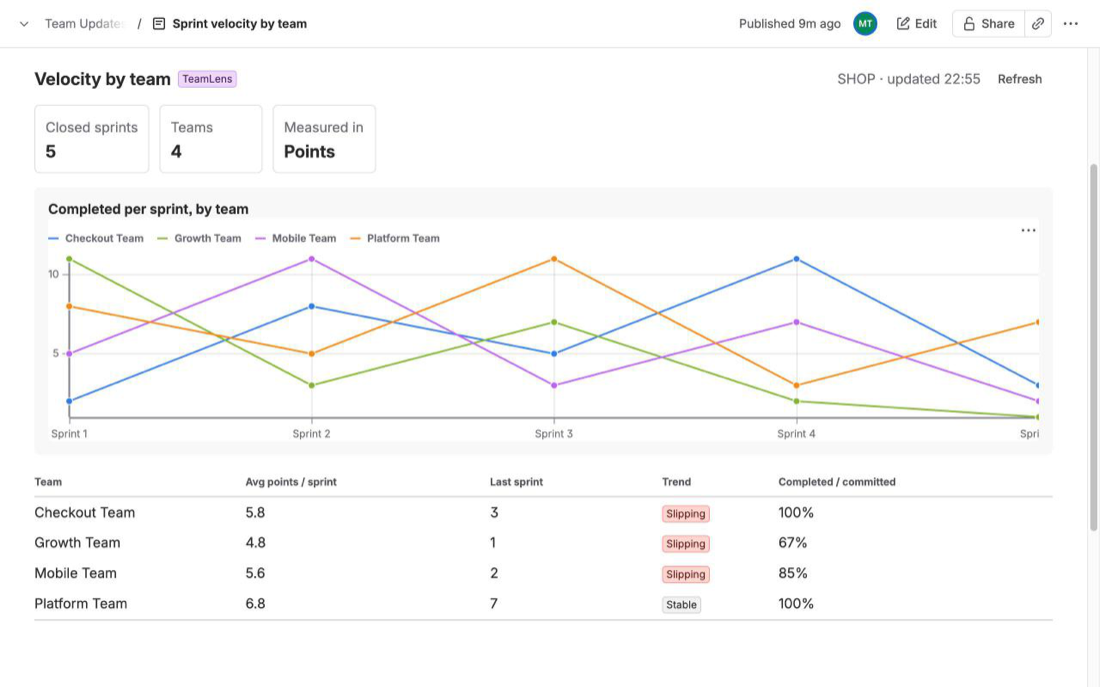
Tiles: closed sprints, teams, and whether the report is measured in story points or issues (points when the site has a story points field).
Chart: completed per sprint, one line per team.
Tables: average per sprint, last sprint, trend (Improving, Stable, Slipping compared with the earlier average) and completed/committed percentage per team; then completed / committed per team per sprint.
How it is computed: closed sprints are read from the Sprint field of issues in scope (JQL sprint in closedSprints(), sprints closed in the last 12 months). Committed = in the sprint when it closed, including carry-overs. Completed = resolved by the sprint close. Scope removed mid-sprint is not modelled. Needs Jira Software.
Was this page helpful? Email support@mortiseapps.com.