 Mortise Apps
LinkLens Dependency Map for monday.com
See every dependency chain on a monday.com board
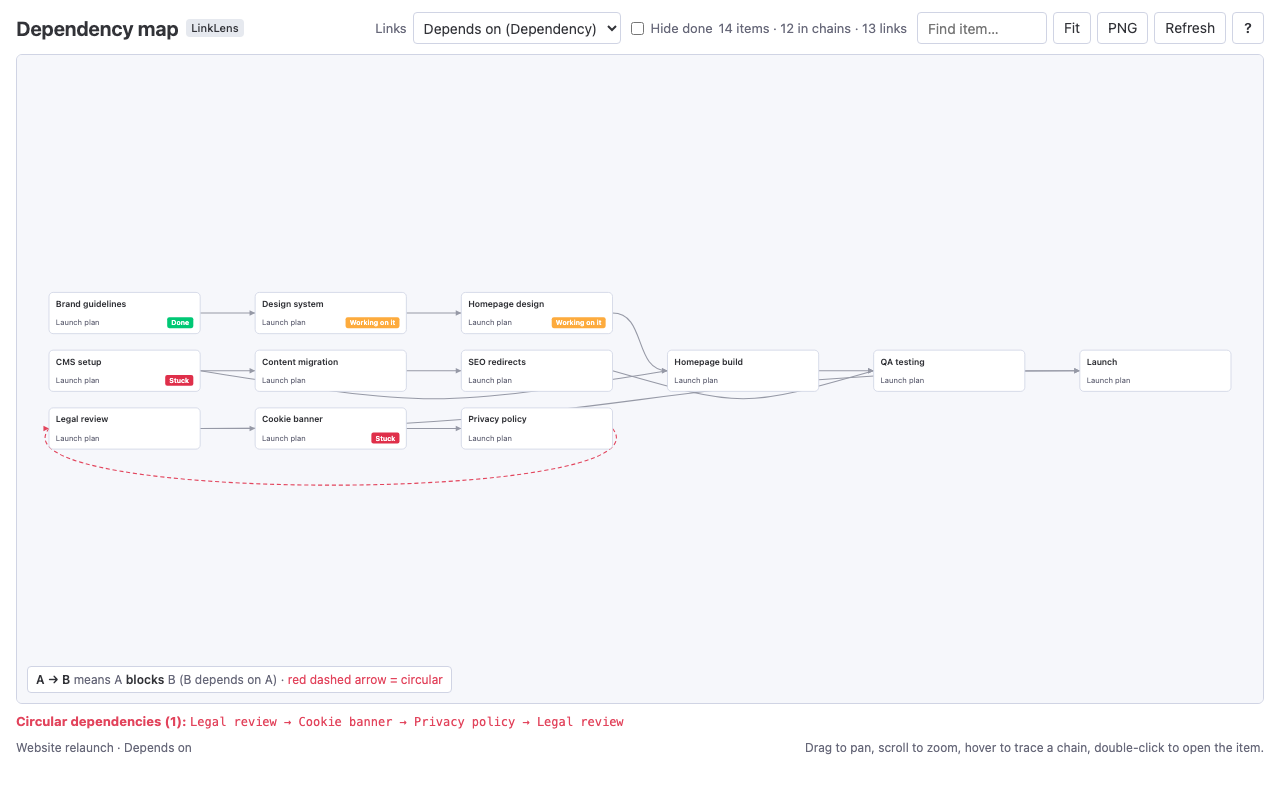
LinkLens Dependency Map is a monday.com board view that draws the links in your Dependency and Connect boards columns as one graph, so you can see what blocks what, how far a delay spreads, and where items wait on each other in a loop.
What LinkLens adds to monday.com
One view, the links you already keep. Nothing is written to your boards.
Every chain on the board, at once
Pick the Dependency column and every chain is drawn left to right: blockers first, blocked work after, separate chains stacked. Items without links are counted, not drawn, so the picture stays readable.
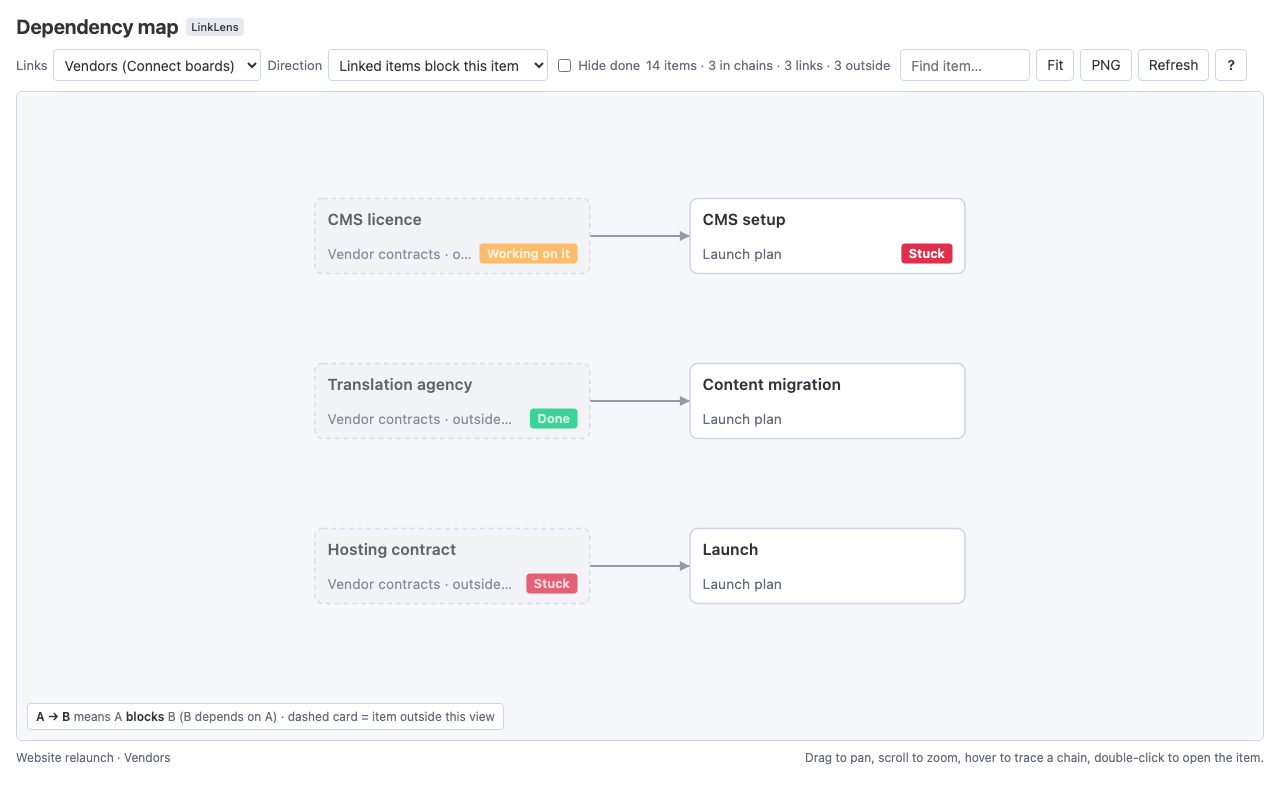
Dependencies across boards
Point it at a Connect boards column and linked items on other boards appear as dashed outside cards with their board name and status, so a vendor contract or another team's task never hides behind a board boundary.
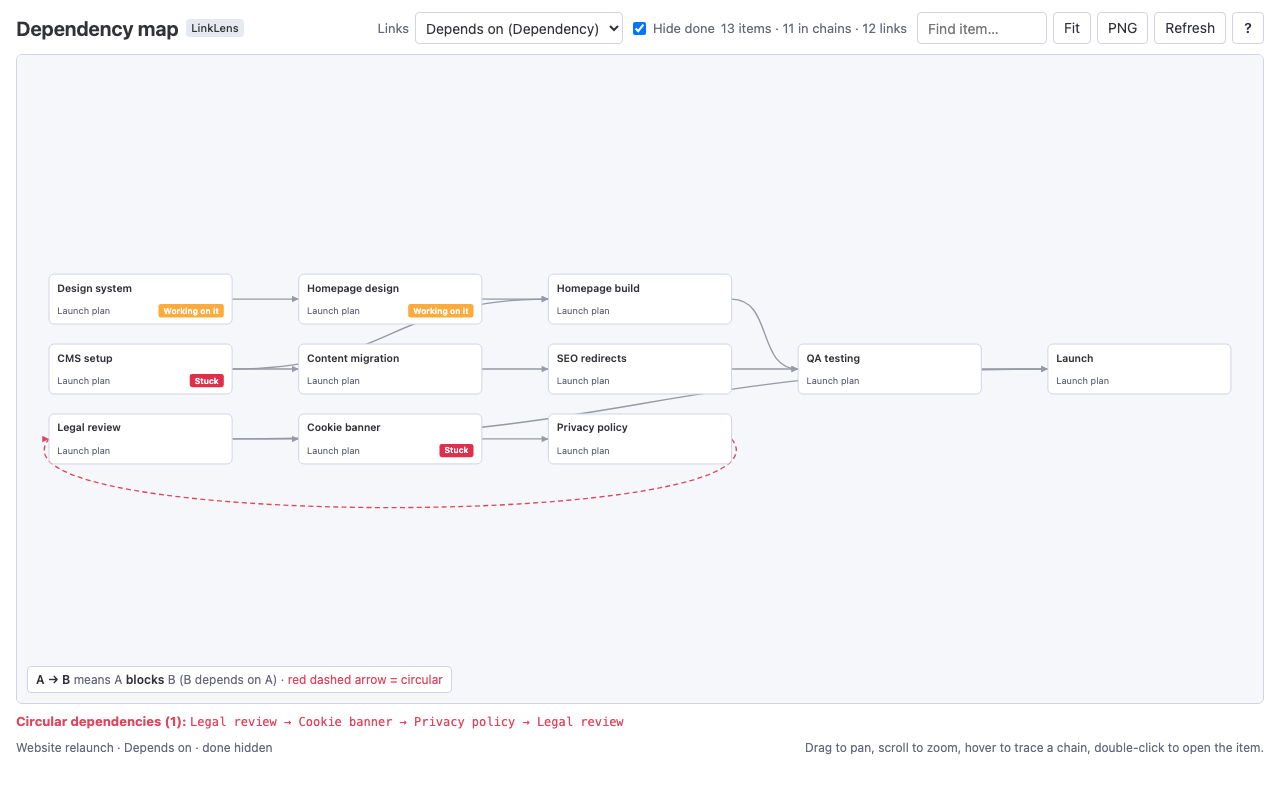
Only the blockers that still matter
Hide done removes finished items and their links, using the status label monday.com marks as done. What is left is the work that is really blocked, and what blocks it.
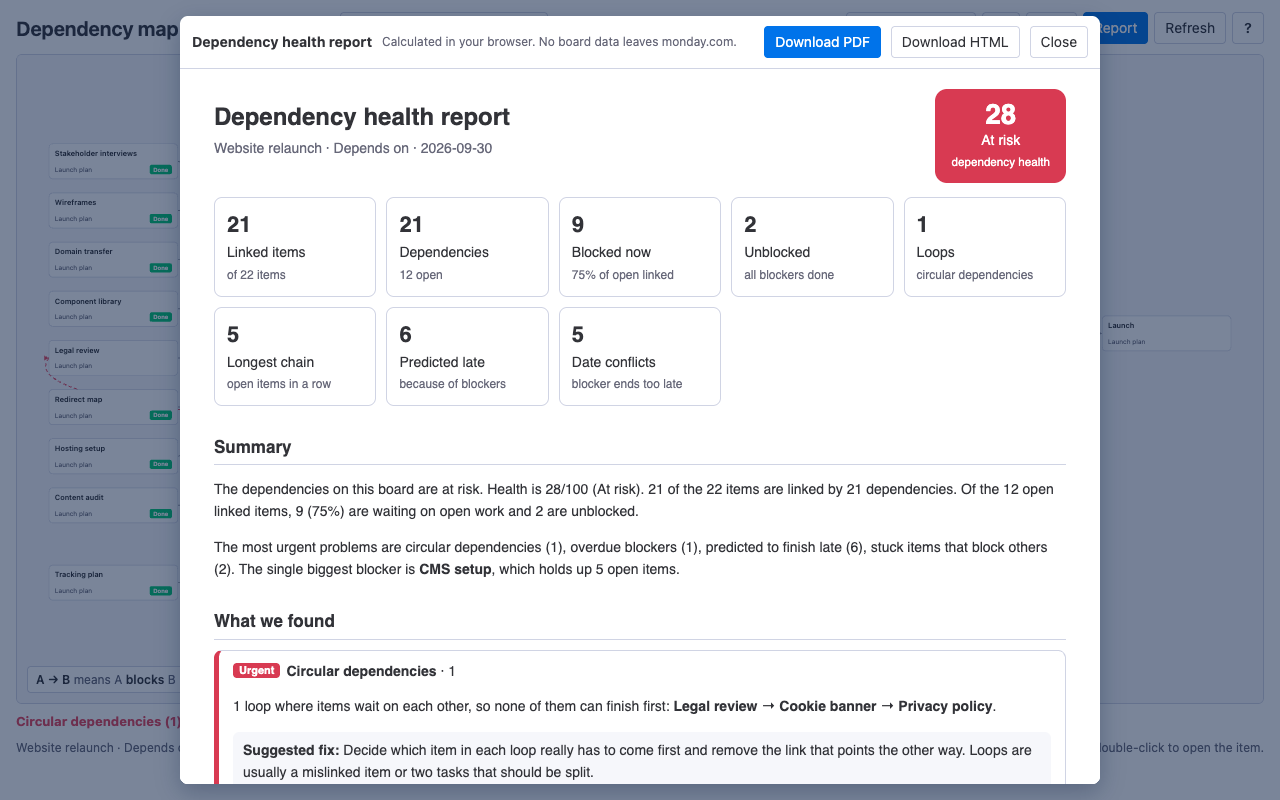
A health report you can hand to stakeholders
One click writes a dependency health report: a score, every risk explained in plain English with a suggested fix, which items will finish late and why, when the open work will clear, and 8-week trends. Download it as PDF. Calculated in your browser; no board data leaves monday.com.
How it works
Five steps, most of them done once.
Add the view
On any monday.com board, click + next to the board's views, choose Apps and pick Dependency Map. The first time, a short welcome guide explains the map.
Link your items
Add a Dependency column (or use a Connect boards column) and pick, for each item, the items it depends on. Connect boards columns can point to items on other boards.
Choose the link column
In the view's toolbar pick the column to draw under Links. For a Connect boards column, choose whether linked items block the item or the other way round.
Read and trace
Blockers are on the left, blocked work on the right; an arrow A → B means A blocks B. Hover or click an item to highlight its whole chain, double-click to open it.
Catch loops and share
Circular dependencies are drawn with a red dashed arrow and listed under the map. Turn on Hide done to keep only live blockers, and use PNG to export the whole map.
Get the health report
Click Report. LinkLens explains every dependency risk in plain English with numbers and a suggested fix: loops, bottlenecks, stuck and overdue blockers, date conflicts, predicted slips, when the open work will clear, and 8-week trends. Download it as PDF or HTML for a status meeting.
Ask Sidekick
Turn on the LinkLens tool in monday Sidekick and ask questions such as "What is blocking Launch?", "What does CMS setup delay?" or "Are there circular dependencies on this board?".
monday.com built in vs LinkLens
What changes once the view is on your board.
| Capability | monday.com built in | With LinkLens |
|---|---|---|
| See dependencies | Arrows on the Gantt timeline | A graph of whole chains |
| First blocker to last blocked item | Follow arrows one by one | Drawn left to right |
| Circular dependencies | Not flagged | Red dashed arrow plus a list |
| Items on other boards | Enterprise cross-project dependencies | Connect boards, any plan |
| Only live blockers | Filter by hand | Hide done |
| Export an image | Screenshot | PNG of the whole map |
| Edit links | In the board | In the board (the view is read-only) |
Frequently asked questions
What does LinkLens Dependency Map do?
It is a monday.com board view that draws the links in a Dependency or Connect boards column as one graph: every chain on the board, blockers on the left, circular dependencies in red, and items on other boards as outside cards.
How is it different from the Gantt view?
The Gantt view shows dependencies on a timeline, one arrow at a time. LinkLens shows the structure: whole chains from the first blocker to the last blocked item, how far a delay spreads, and loops where items wait on each other.
Does it work across boards?
Yes, through Connect boards columns. Linked items on other boards appear as dashed outside cards with their board name and status, as long as the viewer can see those boards.
Which monday.com plans does it work on?
Any plan that has Dependency or Connect boards columns. It does not need monday.com's Enterprise cross-project dependencies.
Does it change my board?
No. The view is read-only. It reads items as the person viewing the board, so nobody sees items they could not already see.
What is in the health report?
A 0-100 dependency health score, every risk found on the board with numbers and a suggested fix (circular dependencies, overdue, stuck and stale blockers, bottlenecks, date conflicts), which items are predicted to finish late and by how many days, when the open linked work is likely to clear at the recent pace, and 8-week trends of links added against blockers finished. It downloads as PDF or HTML.
How are the predictions made?
From the board itself, not from AI guesses. LinkLens follows each chain forward from today using the Timeline or Date column: if a blocker ends after the item behind it is due, that item is predicted late by the difference. The clearing time uses the number of linked items finished per week over the last weeks, shown as a range.
Where is my data stored?
Nowhere outside monday.com. The map and the report are calculated in your browser, the Sidekick answers run on monday code (monday.com's own app hosting), and the view keeps only its settings in monday.com's app storage. No board data is sent to Mortise Apps or to any AI provider.
Can viewers and guests use it?
Yes. The map is read-only, so viewers and guests see it too; only the view settings are not saved for them.
Known limitations. Read-only; one link column at a time; up to 2,000 items per view; items on other boards are shown one hop out and only if the viewer can see them.
Also for Jira and Confluence
The same dependency graph for Jira issue links, inside Jira and in Confluence pages.