How to use LinkLens Dependency Map

A monday.com board view that draws your Dependency and Connect boards links as one graph. Prerequisites: a board with a Dependency column or a Connect boards column; any monday.com plan that has those columns.

  1. Add the view

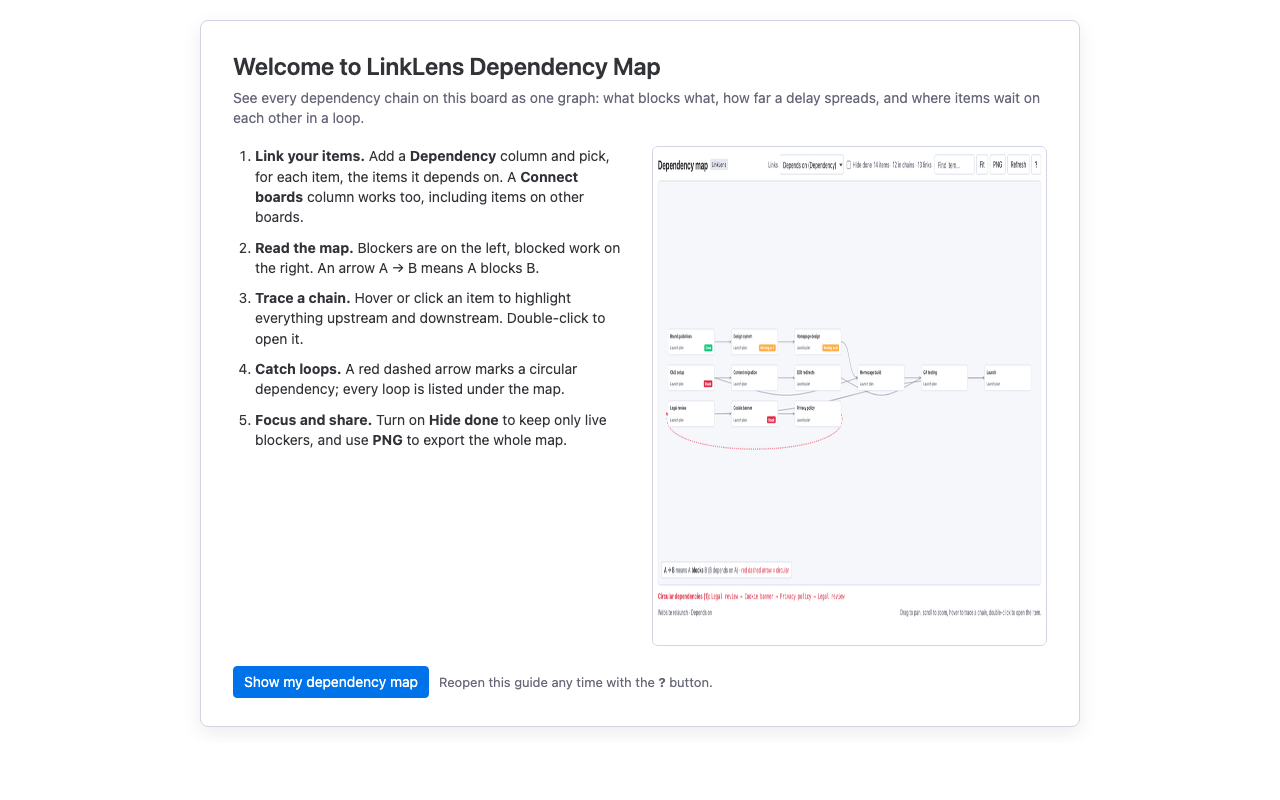
    On any monday.com board, click + next to the board's views, choose Apps and pick Dependency Map. The first time, a short welcome guide explains the map.

  2. Link your items

    Add a Dependency column (or use a Connect boards column) and pick, for each item, the items it depends on. Connect boards columns can point to items on other boards.

  3. Choose the link column

    In the view's toolbar pick the column to draw under Links. For a Connect boards column, choose whether linked items block the item or the other way round.

  4. Read and trace

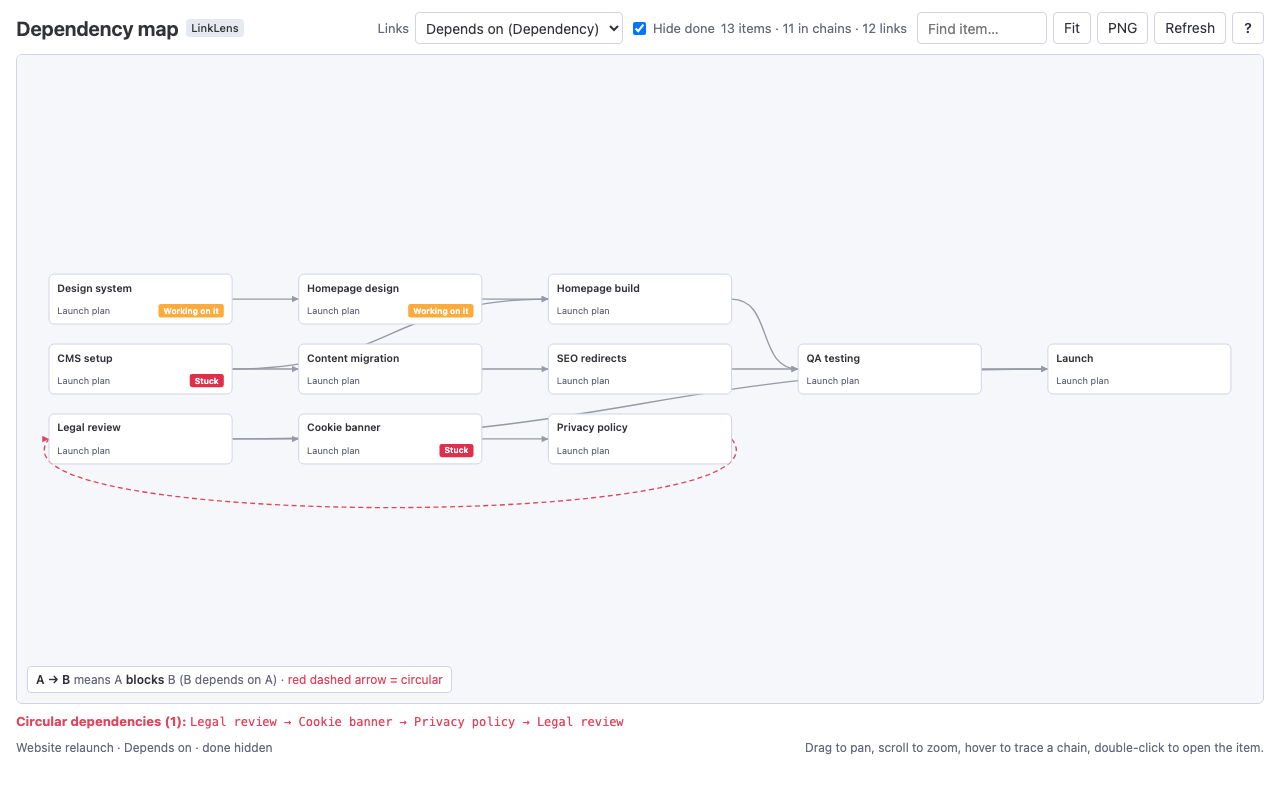
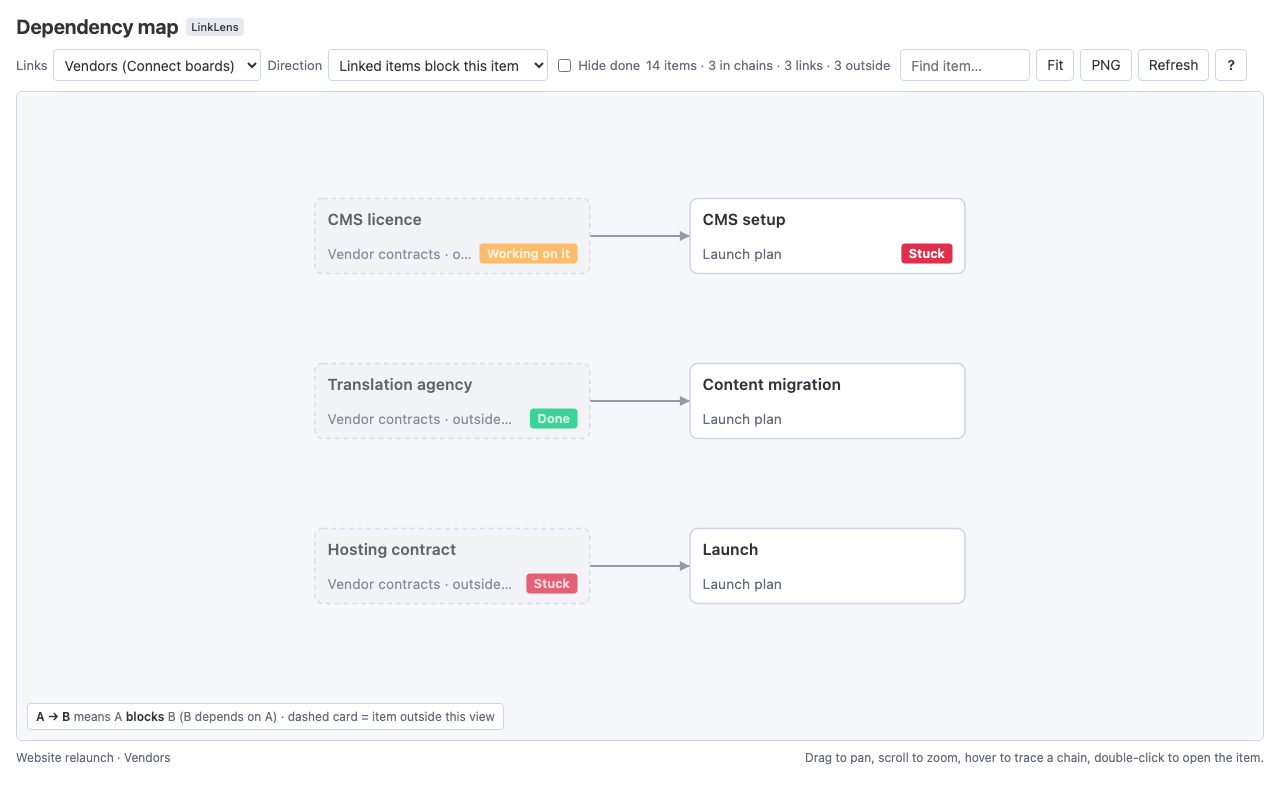
    Blockers are on the left, blocked work on the right; an arrow A → B means A blocks B. Hover or click an item to highlight its whole chain, double-click to open it.

  5. Catch loops and share

    Circular dependencies are drawn with a red dashed arrow and listed under the map. Turn on Hide done to keep only live blockers, and use PNG to export the whole map.

  6. Get the health report

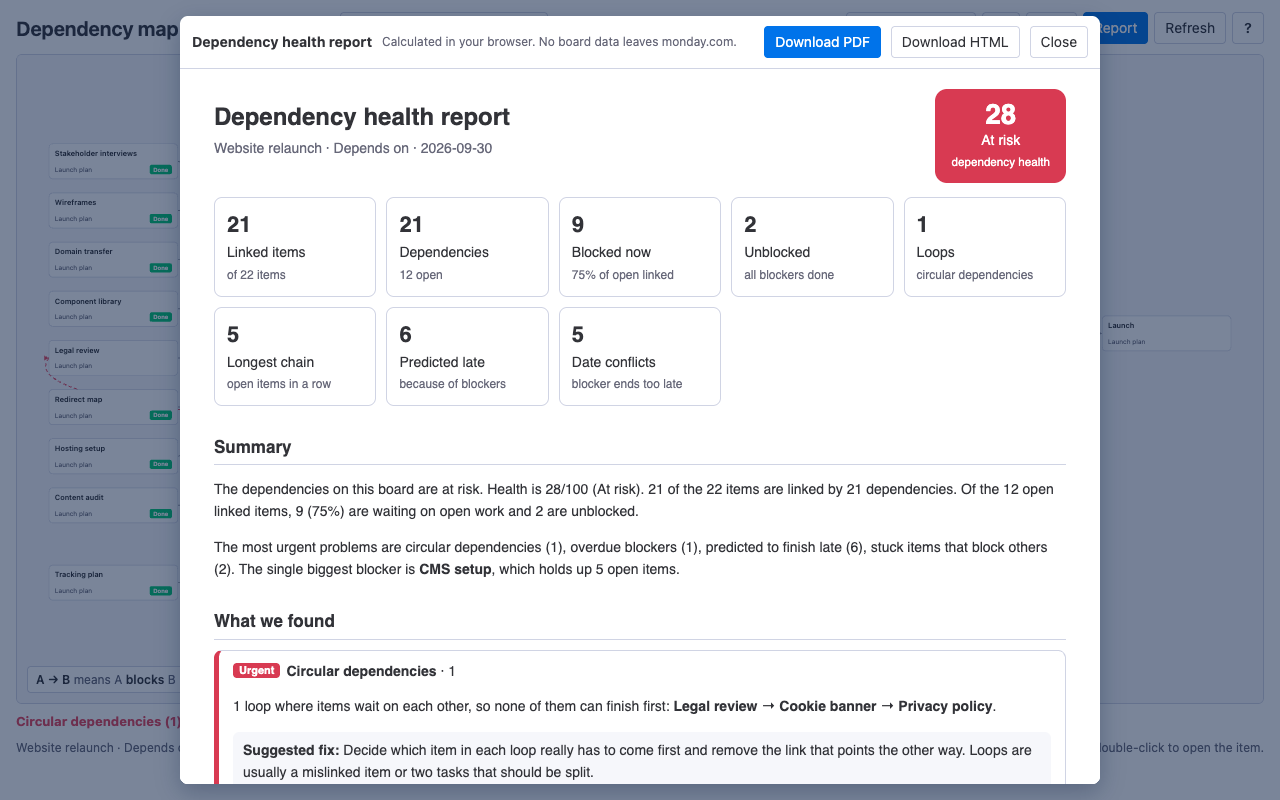
    Click Report. LinkLens explains every dependency risk in plain English with numbers and a suggested fix: loops, bottlenecks, stuck and overdue blockers, date conflicts, predicted slips, when the open work will clear, and 8-week trends. Download it as PDF or HTML for a status meeting.

  7. Ask Sidekick

    Turn on the LinkLens tool in monday Sidekick and ask questions such as "What is blocking Launch?", "What does CMS setup delay?" or "Are there circular dependencies on this board?".
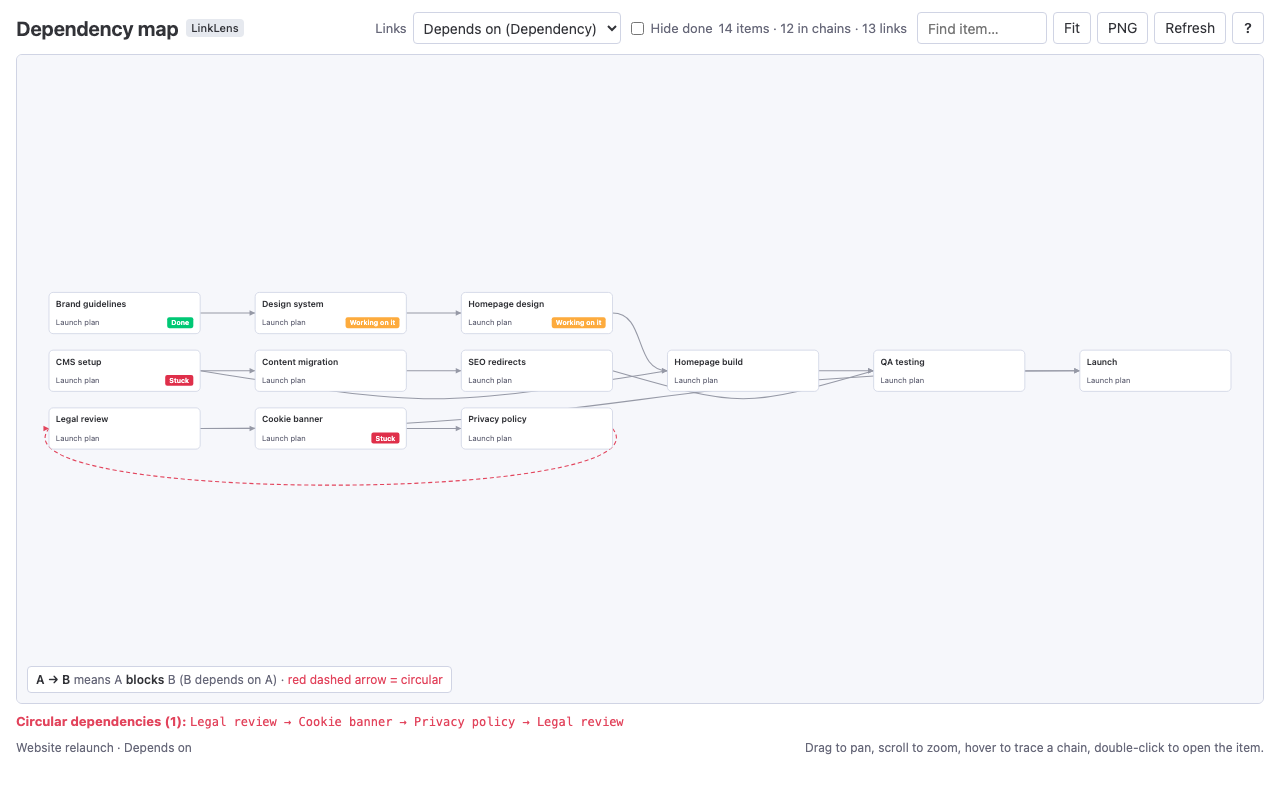
Reading the map. Cards are items, with their group (or their board, for items on other boards) and their status. Dashed cards are items outside this board. A red dashed arrow closes a circular dependency, and every loop is listed under the map. The header counts items, items in chains, links and outside items.
The health report. Click Report in the toolbar. The report has a 0-100 health score, the risks found (each with numbers, the items involved and a suggested fix), predictions (items that will finish late because a blocker ends later, and when the open linked work will clear at the recent pace), 8-week trends and an action plan. Predictions need a Timeline or Date column; trends appear once the board has a week or more of history. Download PDF or Download HTML saves the report; everything is calculated in your browser.
Sidekick. Open monday Sidekick on a board, go to Tools and turn on LinkLens. Then ask, for example, "What is blocking Launch?", "What does CMS setup delay?" or "Are there circular dependencies on this board?". Sidekick confirms before it runs the tool and answers from the board's dependency data.
Who can use it. Admins, members, viewers and guests. The view is read-only and reads items as the person viewing the board; for viewers the view settings are not saved.
The welcome guide shown the first time the view opens
Dependency chains on a board, with a circular dependency in red
Connect boards links to items on another board, shown as outside cards
Hide done keeps only the blockers that still matter
The dependency health report: score, risks with fixes, predictions and trends

Questions: support@mortiseapps.com, reply within one business day. Mortise Apps.