 Mortise Apps
 ConfluenceTeamLens for Confluence
How do you show Jira team velocity on a Confluence page?
Velocity is the number people ask for in sprint reviews and planning pages, yet Jira keeps it on the board. The Velocity Chart is a report of one scrum board, and the Confluence Jira chart macro offers pie, created vs resolved and two-dimensional charts, not a velocity chart. So a Confluence page can link to velocity or show a snapshot of it, but it cannot draw a live velocity chart with the native macros alone.
Short answer: For one team on one scrum board, link the board's Reports > Velocity Chart from the page, or paste a dated screenshot after each sprint. For a live per-team number on the page, you need a macro that reads closed sprints from Jira. Native charts on the page can show related trends (created vs resolved), not velocity.
Checked 23 Oct 2026: Atlassian Support pages "View and understand the velocity chart" and "Insert the Jira chart macro", read 23 Oct 2026. The steps below follow those pages.
What Jira's velocity chart measures
Atlassian's page describes the chart this way:
- It is available on boards that use the Scrum template, under Reports > Velocity Chart in a company-managed software space.
- Commitment (grey bar) is the total estimate of the sprint's work items when the sprint begins. Work added later, and estimate changes after the start, are not in this total.
- Completed (green bar) is the total of completed estimates when the sprint ends, including scope changes made during the sprint.
- The estimate can be story points, original time, work item count or another numeric field.
- It is board-specific: only work items that match the board's saved filter count, and "Done" means the right-most column of that board.
Velocity is then the average completed estimate over the recent sprints on that chart.
Why it does not travel well to Confluence
Three things get in the way when a page should show velocity for several teams:
- One board, one chart. A team that works on two boards, or two teams sharing one board, does not get a per-team number. The chart follows the board filter, not a team.
- No velocity chart type in the Jira chart macro. The macro's chart types are pie, created vs resolved and two-dimensional. A pie chart by status or assignee is a snapshot, not completed work per sprint.
- Screenshots go stale. A pasted chart is correct on the day you paste it and wrong after the next sprint closes.
What you can do with native tools
- Link the report. Put a Smart Link to the board's Velocity Chart in the page, next to the sprint goals. Readers click through to the live chart.
- Show a related trend. A Jira chart macro of type Created vs Resolved over the last sprints (Period: week, Days previously: 84, for example) shows whether the team closes more than it opens. It is not velocity, so label it that way.
- Keep a manual table. After each sprint review, add a row with sprint name, committed and completed from the Velocity Chart. It is honest and cheap, and it is only as current as the last person who updated it.
A live per-team velocity table on the page
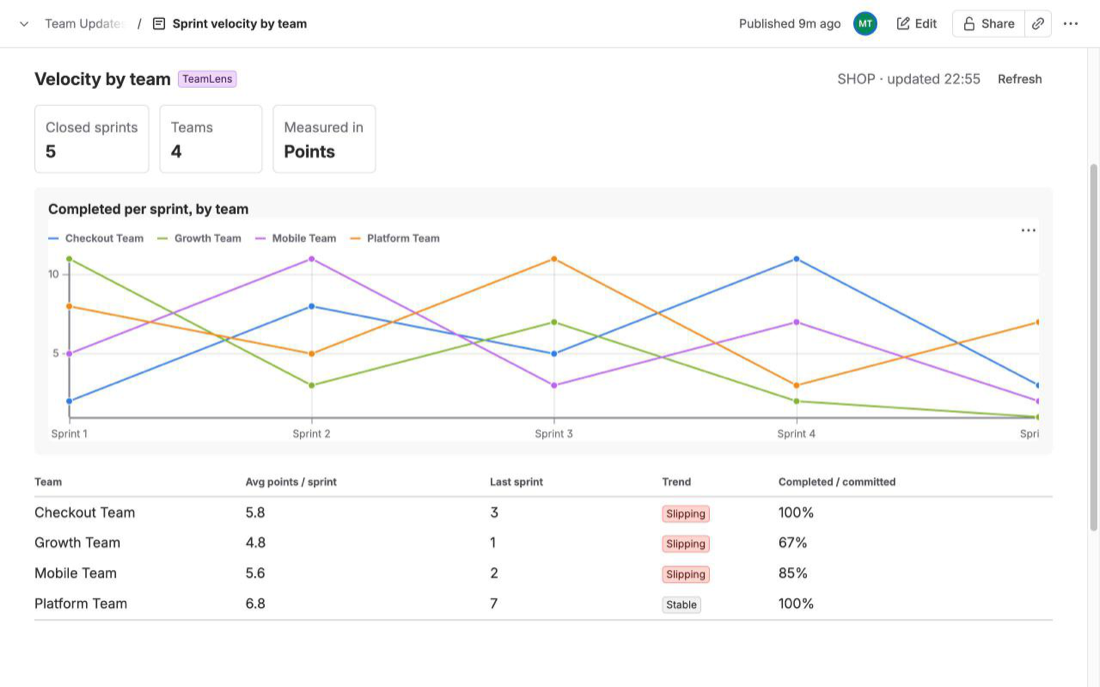
We make TeamLens for Confluence, a macro that adds a Velocity report to a Confluence page. You pick the scope (Jira projects or a JQL query), optionally limit it to some Atlassian teams, and choose the last 4, 6, 8, 10 or 12 closed sprints. The page then shows completed per sprint with one line per team, and a table with the average per sprint, the last sprint, a trend (Improving, Stable or Slipping against the earlier average) and the completed/committed percentage per team.
It counts differently from Jira's chart, and the page should say so:
- Sprints come from the Sprint field of the work items in scope (
sprint in closedSprints(), closed in the last 12 months), so a team is measured across every board its work items sit on. - Committed means the work item was in the sprint when it closed, carry-overs included. Jira's chart counts commitment at sprint start.
- Completed means resolved by the sprint close. Scope removed mid-sprint is not modelled, and it needs Jira Software sprints.
The full rules are in the velocity report docs. If one board per team is how you work, the native chart and a link are enough.
FAQ
Can the Jira chart macro show a velocity chart?
No. On Atlassian's page the macro's chart types are pie, created vs resolved and two-dimensional. None of them shows committed and completed work per sprint.
Why does my velocity differ between Jira and a Confluence report?
Check three things: which work items are in scope (board filter versus project or JQL scope), when commitment is counted (sprint start versus sprint close), and what "done" means (right-most board column versus resolved).
Does velocity work for kanban boards?
Jira's Velocity Chart needs the Scrum template, and a velocity report built on closed sprints needs sprints too. For kanban, look at throughput or cycle time instead.
Related reading: Show Jira work by team on a Confluence status page and Team velocity across boards in Jira.
Sources
- View and understand the velocity chart, Atlassian Support - Scrum template only, Reports > Velocity Chart, commitment at sprint start, completed at sprint end, estimation statistics, board-specific. Read 23 Oct 2026.
- Insert the Jira chart macro, Atlassian Support - pie, created vs resolved and two-dimensional charts and their display options. Read 23 Oct 2026.
- TeamLens for Confluence: Velocity report - how the macro computes committed, completed and trend.