 Mortise Apps
TeamLens for Jira
Team velocity in Jira when teams do not match boards: velocity per Atlassian Team across sprints
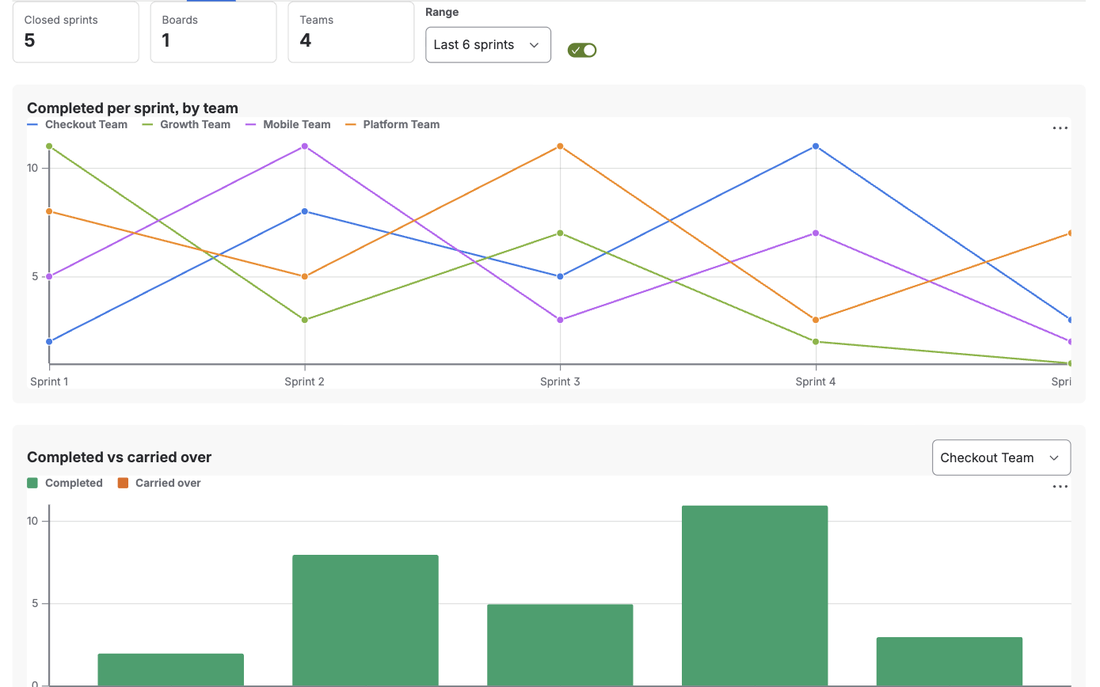
Team velocity in Jira is the amount of work, in story points or issues, that a team completes per sprint. Jira Cloud's Velocity Chart computes it per board: it does not know which team did the work, so it only matches team velocity when exactly one team owns exactly one board. TeamLens for Jira adds a Velocity report that groups completed and committed work by the Atlassian Team field across every board in a set of projects, for the last 4 to 12 closed sprints, with the average, the trend and completed-over-committed per team.
The board is not the team
Jira's Velocity Chart is a good chart. Commitment and completion per sprint, on one board. The trouble is the assumption underneath: that a board is a team.
It often is not. A platform team pulls from three product boards. A shared "Storefront" board is worked by four teams. A company-managed project has one board for everything and the Team field is what says who owns what. In each case the Velocity Chart answers "how much did this board close?", which is not the number the engineering manager wants.
The manager wants, per team: are we stable, improving or slipping, and how much of what we commit do we actually finish?
What native Jira gets you
- One board per team. Create a board with the filter
"Team[Team]" = <uuid>and read its Velocity Chart. This works if the team's sprints are its own. If several teams share a sprint cadence on one project, each team-board sees the same sprints and the chart is correct per board, but it is four boards to maintain, one UUID each, and nobody looks at four charts. - The Sprint Report per board shows committed, completed, removed and added scope for one sprint. Precise, but per sprint and per board, with no team dimension.
- Plans capacity shows planned capacity per team per sprint. It is planning, not history, and it is Premium only.
A real example: five sprints, four teams, one project
An e-commerce project runs two-week sprints. Four teams work in it. Over the last five sprints the numbers per team look like this once you group by the Team field:
- Checkout completed 2, 8, 5, 11 and 3 points. Average 5.8, last sprint well below it: slipping.
- Growth committed 11, 6, 10, 4 and 5 and completed 11, 3, 7, 2 and 1. Completed over committed is 67 percent: over-committed, and getting worse.
- Platform completed 8, 5, 11, 3, 7 with everything it committed: stable and predictable.
The project's single Velocity Chart shows one line, the sum, which looks perfectly healthy. The Growth problem is invisible in it.
How TeamLens computes velocity per team
Open Team reports in the project (or Apps, TeamLens Team reports for several projects) and select Velocity.
TeamLens does not read board configuration. It reads each issue's Sprint field, which in Jira Cloud lists every sprint the issue was part of, with each sprint's state and close date. From that it finds the closed sprints in the scope, keeps the last N (4, 6, 8, 10 or 12, default 6, ordered by close date), and for each team and sprint counts:
| Term | Definition |
|---|---|
| Committed | Issues in the sprint when it closed, including items carried over from an earlier sprint. |
| Completed | Issues resolved by the sprint's close. An issue that spans sprints is credited to the sprint in which it was resolved. |
| Carried over | Committed minus completed. |
The report then shows a line chart of completed per sprint by team, a completed-versus-carried-over bar chart for any one team, and a table per team with the average, the last sprint, a trend lozenge (Improving if the last sprint is at least 10 percent above the average of the earlier sprints, Slipping if at least 10 percent below, otherwise Stable), completed / committed as a predictability percentage (below 70 percent is marked over-committed), and one column per sprint with completed / committed.
Story points are used when a points field exists; a toggle switches to issue counts, which is the honest measure for teams that do not estimate.
Because it works from the Sprint field, it needs no board setup, combines sprints from several boards, and follows the team even when the team moves between boards.
What it does not model
Scope changes inside a sprint. Jira's Sprint Report knows an issue was added on day three or removed on day eight; TeamLens credits a sprint with what it held at close. For most teams the difference is small, and the per-team view is what the Sprint Report cannot give. If mid-sprint churn is your problem, keep the Sprint Report for the board and use TeamLens for the team.
Velocity also needs Jira Software sprints. Business and Service Management projects get the other four reports and an empty Velocity tab.
FAQ
Do I need one board per team?
No. Any boards, any number, as long as issues carry the Team field and were in sprints that have been closed.
Why is my team "Slipping" after one bad sprint?
The trend compares the latest sprint with the average of the earlier ones. One low sprint flags Slipping; read the per-sprint columns next to it before drawing conclusions.
What does it cost?
TeamLens is free for sites with up to 10 users and USD 1 per user per month above that, billed by Atlassian with a 30-day trial. It is on the Atlassian Marketplace; definitions are in the Team reports documentation.
Sources
- View and understand the velocity chart, Atlassian Support - the native chart is per board.
- View and understand the sprint report, Atlassian Support - committed, completed, added and removed scope for one board and sprint.
- Teams in Jira projects, Atlassian Support - the Team field the report groups by.
- Team field in Jira REST API, Atlassian Developer - how the field is stored.
- JRACLOUD-87808, Team field not supported for sorting on gadgets, JQL or boards - the general gap for reporting by team.