 Mortise Apps
 ConfluenceTeamLens for Confluence
How do I put Jira reports in a Confluence page? Four native ways compared
Most weekly status pages in Confluence end up as screenshots of Jira, pasted on Monday and wrong by Wednesday. Confluence Cloud has four built-in ways to show live Jira data on a page instead, and they do quite different jobs. This page compares them side by side, says which report each one suits, and names the one gap none of them closes: totals per Atlassian team.
Short answer: Use the Jira Issues macro for a list or a count from a JQL query, the Jira Chart macro for a pie chart, a created-vs-resolved trend or a two-dimensional table by status, priority, assignee, fix version, component or issue type, and a Smart Link in embed view when you want a whole Jira dashboard, a single gadget, or a board, backlog or timeline on the page. None of the four can group or total by the Atlassian Team field, because Jira's own charts and gadgets cannot use Team as a statistic type. For per-team reports you need one macro per team, or an app.
Checked 7 Oct 2026: Atlassian's support pages for the Jira Issues macro, the Jira Chart macro, sharing Jira dashboards and boards in Confluence and Smart Links in Jira, plus three issues on Atlassian's public tracker (votes as read that day). We did not rebuild each option on a test site for this article; where Atlassian's pages are silent, we say so.
The 90-second video version: Jira reports in Confluence: 4 built-in ways compared (YouTube). In under 30 seconds each: the four ways and why an embedded board loses its filter.
The four options at a glance
| Option | What it shows | How you add it | Groups or totals by Team? | Notes from Atlassian's docs |
|---|---|---|---|---|
| Jira Issues macro ("Display Jira work items in a list") | A table of work items, one item, or a count, from JQL, a filter or a Jira URL | /Jira in the editor, then a query | No | You choose and reorder the columns; no group-by option is documented |
| Jira Chart macro | Pie chart, created vs resolved, two-dimensional table | /Jira chart, then a query | No | Pie and 2D axes: Status, Priority, Assignee, Fix version, Component, Issue type |
| Embedded Jira dashboard or gadget | The dashboard (or one gadget) as it looks in Jira | Copy the dashboard's or gadget's link in Jira, paste it on the page | No (gadgets cannot use Team as a statistic type) | Renders as a Smart Link in embed view |
| Embedded board, backlog, list or timeline | The Jira view itself, interactive | Copy the board's link, paste it on the page | Only if the board itself filters to one team | Viewers need access to the Jira space; filters reset when the page reloads |
1. Jira Issues macro: lists and counts
The Jira Issues macro (Atlassian's documentation now calls it "Display Jira work items in a list") takes a JQL query, a saved filter or a pasted Jira URL. It has three views: a list (the default), a single work item, and a count view that shows "just the number of work items". In the list you pick which columns appear and drag them into order.
Use it for anything that is naturally a list: the open bugs in a release, everything in the current sprint, the work items flagged as blocked right now (flagged is not EMPTY AND statusCategory != Done).
What it does not do is break a list into groups or add up a column per value. A list of 60 work items with a Team column is still 60 rows. For a count per team, you need one macro in count view per team, each filtered on that team's ID (the JQL is "Team[Team]" = <team id>). We walked through that setup in how to show Jira work by team in a Confluence status page.
2. Jira Chart macro: three chart types, six fields
The Jira Chart macro draws three charts from a JQL query:
- Pie chart, grouped by Status, Fix version, Assignee name, Priority, Component or Issue type.
- Created vs resolved, the number of work items created against resolved over time.
- Two-dimensional chart, a matrix whose X and Y axes come from Status, Priority, Assignee, Fix version, Component and Issue type.
That covers "open work by status" and "bugs by priority and assignee" well. Team is not in either list. Atlassian's documentation also notes that if the query includes items anonymous users cannot see, viewers "will be prompted to authenticate to view charts".
3. An embedded Jira dashboard or a single gadget
If the report already exists as a Jira dashboard, you can bring the whole thing into Confluence. In Jira, select the link icon at the top of the dashboard (or in the upper right corner of a single gadget) to copy its link, then paste the link into a page, blog post, whiteboard or database. Atlassian's page says it "will render as a Smart Link in embed view". The request for this, CONFCLOUD-70116 ("a macro that displays a Jira dashboard within the page"), is now closed as Fixed, with 572 votes on 7 October 2026.
This is the closest thing to "put my Jira report in Confluence" that ships with the product: whatever gadgets you have built in Jira appear on the page. It also inherits the gadgets' limits. On Jira dashboards, the Team field cannot be used as the statistic type in the Pie Chart, Issue Statistics or Two Dimensional gadgets. Atlassian tracks that gap as JRACLOUD-87808, open since October 2020 and still "Gathering Interest", with 649 votes when we checked on 7 October 2026.
Atlassian's dashboard-sharing page does not say what a viewer without access to the dashboard sees in the embed, so check that with a colleague's account before you send the page to stakeholders.
4. An embedded board, backlog, list or timeline
The same copy-and-paste works for a board or backlog: copy the link from the board's share icon, paste it, and it renders in embed view. Atlassian's Smart Links page says "users with access to the Jira space can view the Embed Smart Link of the board, list, timeline, calendar, or form", and that the embeds are interactive: viewers can change filters, create items inline (unless required fields block it) and adjust dates on a timeline.
Two details matter on a status page. First, "when the page with the embedded link is reloaded, the view will reset to today's date and all filters will reset to those that were applied when the URL was originally pasted", so set the filters you want before you paste. Second, an open suggestion on Atlassian's tracker, CONFCLOUD-83256, reports that the board embed shows only Jira's default fields, not columns you added yourself (1 vote, Gathering Interest, 7 October 2026).
A board embed is a good fit for a stand-up or a sprint review page. It is a view of the work, not a report: no totals, no trend.
Which one for which report
| You want | Use |
|---|---|
| A list of specific work items that stays current | Jira Issues macro, list view |
| One number on the page (open bugs, items in review) | Jira Issues macro, count view |
| Open work by status, priority or assignee | Jira Chart macro, pie or two-dimensional |
| Is the backlog growing? | Jira Chart macro, created vs resolved |
| A dashboard you already maintain in Jira | Embed the dashboard or one gadget |
| The live board for a stand-up | Embed the board |
| Open, blocked and overdue work per team, velocity per team across boards, cross-team dependencies | Not covered natively: one macro per team, or an app |
The gap: reports per Atlassian team
All four native options group by the fields Jira's charts know about. The Atlassian Team field is not one of them, so a page that should answer "how is each team doing?" falls back on one Jira Issues macro per team and per number. Six teams times three numbers (open, blocked, overdue) is eighteen macros and eighteen hand-written queries with team IDs in them, and a new or renamed team means editing the page. The step-by-step version of that workaround is still the best free option.
How TeamLens for Confluence fits
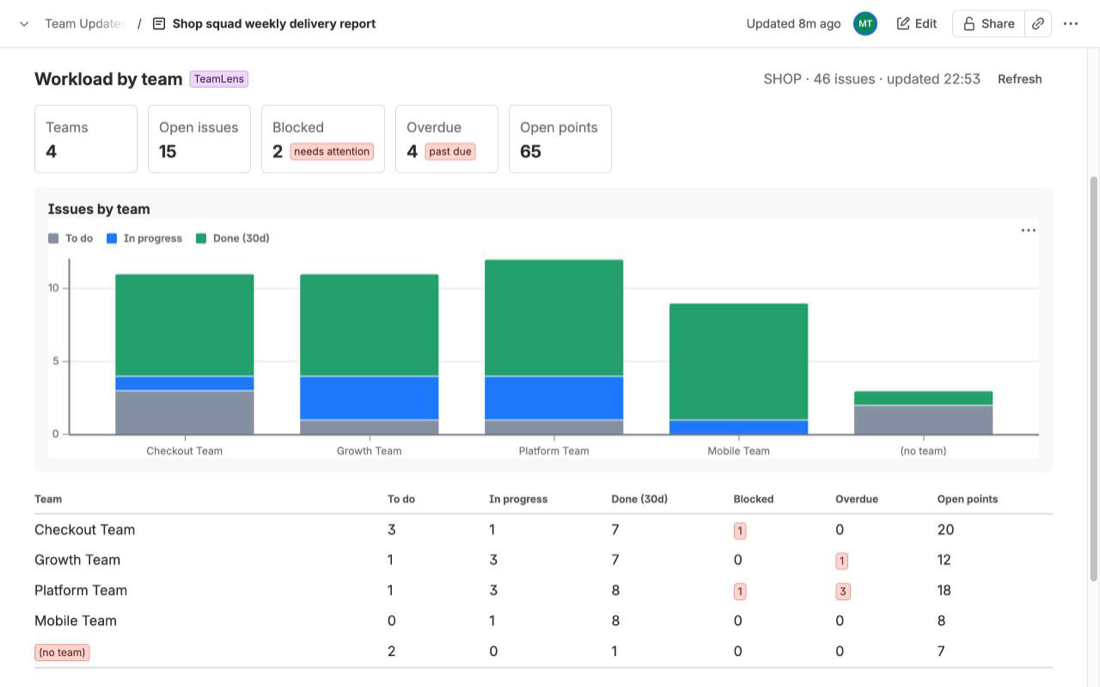
We make TeamLens for Confluence, a Confluence macro that reads Jira work from the same Atlassian site and groups it by the Team field directly. It went live on the Atlassian Marketplace on 7 October 2026. You insert it with /TeamLens, choose a report and a scope (Jira projects or any JQL, such as filter = 12345) and optionally some teams. The reports are Workload (to do, in progress, done in the last 30 days, blocked, overdue and open story points per team, with a "(no team)" row), Aging, Hygiene, Velocity across every board in the scope, and a who-waits-on-whom Dependencies matrix.
The limits, so you can rule it in or out quickly: it reads only the Jira on the same site, counts up to 3,000 work items per macro, needs Jira Software sprints for Velocity, shows a placeholder in PDF and Word exports, and viewers without Jira access see a "No access to Jira" message. Each viewer loads the report with their own Jira permissions; the app has one read-only scope (read:jira-work), no backend and no storage. It is free for sites with up to 10 users, with paid tiers above that billed by Atlassian. Details: the TeamLens for Confluence page and the getting-started guide.
FAQ
Can I put a Jira velocity chart in a Confluence page?
Not as a native macro: Atlassian's Jira macros are the list, count and chart macros described above, and the Jira Chart macro has no velocity chart. If your Jira dashboard has a gadget that shows what you need, copy that gadget's link and paste it into the page as an embed. For velocity per Atlassian team across several boards, see team velocity when teams do not match boards.
Are Jira macros in Confluence live or a snapshot?
The macros query Jira and embeds show the Jira view, so they reflect Jira rather than the day you built the page. Viewers may be asked to log in to Jira first, and what each person sees depends on their Jira access. For a frozen record, such as end-of-sprint numbers, take a screenshot or copy the values into a table.
Can the Jira Chart macro group by the Team field?
No. Atlassian documents six fields for the pie chart and the two-dimensional chart axes (status, priority, assignee, fix version, component, issue type), and Team is not one of them. The same limit applies to Jira's own dashboard gadgets (JRACLOUD-87808).
Do people need a Jira licence to see these on a Confluence page?
Atlassian's pages say viewers may be prompted to authenticate for the chart macro, and that users with access to the Jira space can view embedded boards. Plan for every reader of a Jira-backed status page to have Jira access; otherwise share a static copy.
Sources
- Display Jira work items in a list, Atlassian Support - list, single item and count views; choosing and reordering columns. Read 7 Oct 2026.
- Insert the Jira chart macro, Atlassian Support - the three chart types, the fields for pie and two-dimensional charts, the authentication prompt. Read 7 Oct 2026.
- Share Jira dashboards in Confluence, Atlassian Support - copy a dashboard or gadget link, paste it, embed view. Read 7 Oct 2026.
- Share a Jira board or backlog in Confluence, Atlassian Support - board and backlog embeds. Read 7 Oct 2026.
- Smart Links in Jira, Atlassian Support - who can view embeds, interactivity, filters resetting on reload. Read 7 Oct 2026.
- CONFCLOUD-70116, a macro that displays a Jira dashboard within the page - Closed, Fixed, 572 votes on 7 Oct 2026.
- JRACLOUD-87808, Team field not supported for sorting on gadgets, JQL or boards - Gathering Interest, 649 votes on 7 Oct 2026.
- CONFCLOUD-83256, Smart Link (embed view) only displays default Jira fields - Gathering Interest, 1 vote on 7 Oct 2026.