 Mortise Apps
LinkLens for monday.com
How to see every dependency chain on a monday.com board
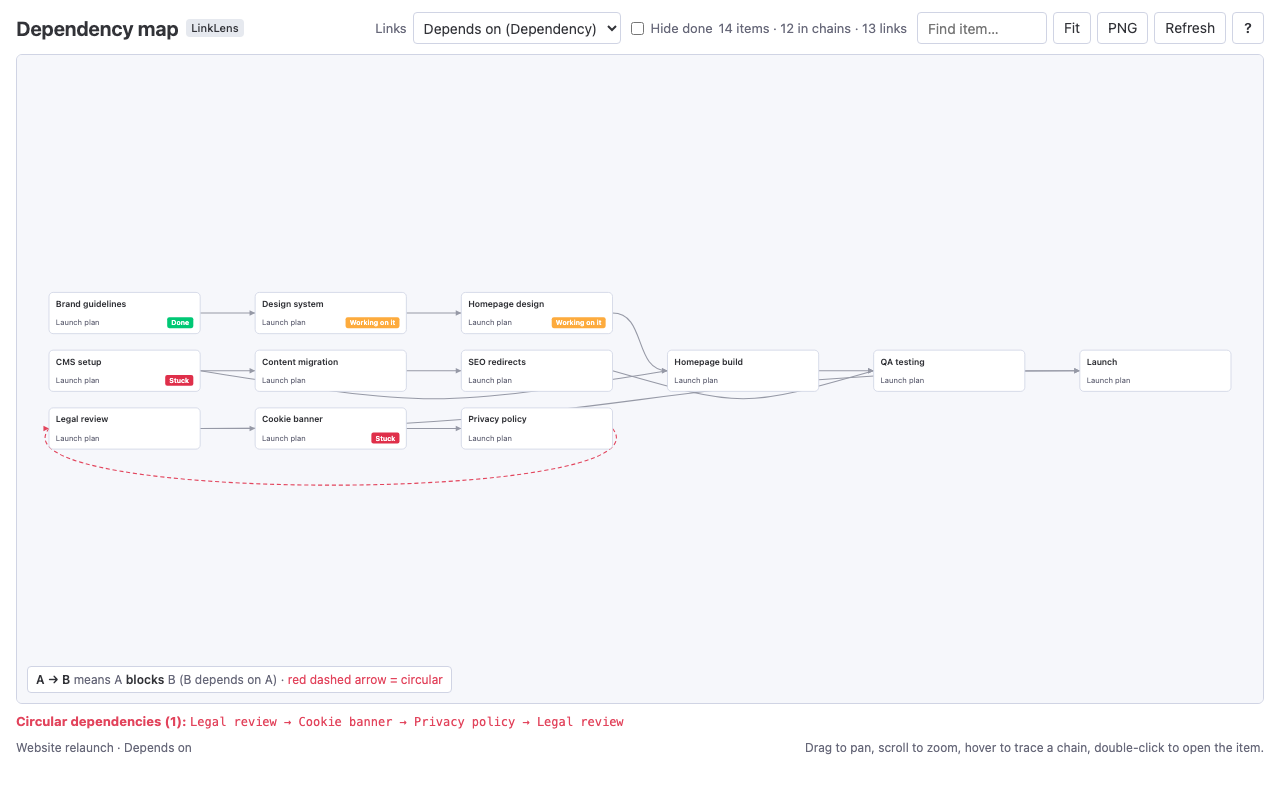
To see how work on a monday.com board depends on other work, you add a Dependency column and pick, for each item, the items it waits on. monday.com then draws each link as a line in the Gantt view and can push dates when a predecessor moves. What it does not show is the structure: which item sits at the start of a chain, how many items a slip would drag along, and where two items wait on each other in a loop. This article covers what the built-in tools do, how far you get with them, and how to see the whole picture with LinkLens Dependency Map, our board view.
What monday.com gives you out of the box
The Dependency column stores, for each item, the items it depends on. Three things use it:
- The Gantt view draws a connector line from each predecessor to the item that waits on it, laid out on the Timeline column. Good for one release plan on one screen.
- Dependency automations, such as "when a date changes, push the dependent items". These keep dates consistent but say nothing about risk.
- Connect boards columns, which link items across boards. They are not dependencies by themselves, but many teams use them that way: a vendor contract on one board that a launch on another board waits for.
The monday.com support article on dependencies covers the setup. It is quick, and for a short plan it is enough.
Where the Gantt view stops
The Gantt view answers "what comes before this bar". It struggles with three questions that project managers ask every week.
How far does a delay spread? If CMS setup slips, the Gantt shows the line to Content migration. It does not show that SEO redirects, QA testing and Launch are behind that, five items deep. You follow the lines by hand.
Which item is the real bottleneck? The item with the most work behind it is rarely the one that looks urgent. A small task that three chains pass through is the one to staff first, and nothing in the Gantt ranks items that way.
Where are the loops? A loop (A waits on B, B waits on C, C waits on A) means none of the three can finish first. Loops usually arrive through Connect boards columns, imports, automations or the API rather than by hand, and a Gantt line has no way to say "this one goes backwards".
Items on other boards add a fourth problem: the Gantt only shows one board, so a cross-board dependency is invisible until someone opens the other board.
What you can do natively
| Question | Built-in answer | Effort |
|---|---|---|
| What comes right before this item? | Dependency column, Gantt connector | Low |
| What is everything upstream of this item? | Follow Gantt lines by hand, or a formula per hop | High, breaks past two hops |
| Which items block the most work? | No native view | Not available |
| Are there circular dependencies? | No native check for chains longer than two | Not available |
| Dependencies across boards | Enterprise cross-project dependencies, or Connect boards columns read by hand | Plan-dependent |
| A report for stakeholders | Export the Gantt as an image | Shows lines, not risks |
If you only need the first row, stop here; monday.com does it well.
See the whole structure: LinkLens Dependency Map
LinkLens Dependency Map is a monday.com board view. Add it to a board, pick the Dependency column (or a Connect boards column) and it draws every chain on the board as one graph: blockers on the left, blocked work on the right, separate chains stacked, items without links counted but not drawn. Each card shows the item's group and status.
What that gives you, using the questions above:
- Delay spread. Hover any item and its whole chain lights up, upstream and downstream. Double-click to open the item.
- Bottlenecks. The layout puts the first blockers on the left; the item with the most cards to its right holds up the most work.
- Loops. A circular dependency is drawn with a red dashed arrow and every loop is listed under the map.
- Other boards. With a Connect boards column, linked items on other boards appear as dashed outside cards with their board name and status.
- Focus. Hide done removes finished items and their links, so what remains is the work that is really blocked today.
The dependency health report
The Report button turns the same data into a document you can hand to stakeholders: a 0-100 dependency health score, every risk found on the board explained in plain English with the items involved and a suggested fix (circular dependencies, overdue and stuck blockers, bottlenecks, stale blockers, date conflicts), which items are predicted to finish late and by how many days, when the open linked work is likely to clear at the recent pace, and 8-week trends of links added against blockers finished. It downloads as PDF or HTML.
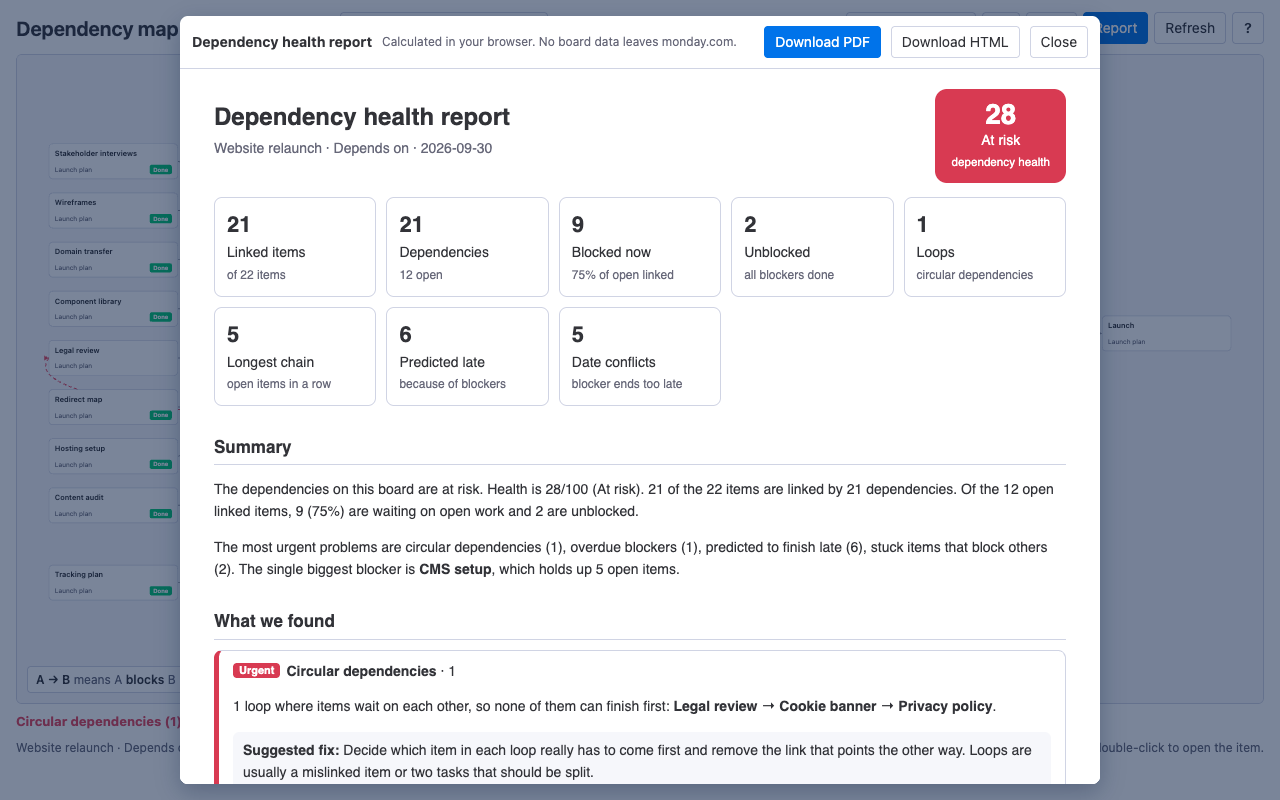
The predictions come from the board, not from guesses: LinkLens follows each chain forward from today using the Timeline or Date column, and if a blocker ends after the item behind it is due, that item is predicted late by the difference. Everything is calculated in your browser; no board data leaves monday.com.
Ask Sidekick instead of opening the view
LinkLens also adds a tool to monday Sidekick, monday.com's AI assistant. Turn the LinkLens tool on and ask, in the chat, "What is blocking Launch?", "What does CMS setup delay?" or "Are there circular dependencies on this board?". Sidekick calls LinkLens for the answer, which comes from the board's real links.
What LinkLens does not do
It does not change dates, create links or write to your board; it is read-only. It does not replace the Gantt view for scheduling. And it reads items as the person viewing the board, so it never shows anyone an item they could not already open.
FAQ
Do I need the Enterprise plan for cross-board dependencies?
Not for LinkLens: it reads Connect boards columns, which exist on every plan that has them, and shows linked items on other boards as outside cards. monday.com's own cross-project dependencies feature is separate.
Does the Dependency column allow circular dependencies?
Loops rarely come from typing them in by hand. They arrive through Connect boards columns, board imports, automations and the API. LinkLens draws them in red and lists them so you can remove the link that points backwards.
Can viewers and guests see the map?
Yes. The view is read-only, so viewers and guests get the same map and report; only their view settings are not saved.
Sources
- Dependencies on monday.com, monday.com support: setting up the Dependency column and how the Gantt view and automations use it.
- Working with the dependency column, monday.com developer documentation: how dependency data is stored and read.
- Task dependencies in project management, monday.com blog: dependency types and why chains matter.