 Mortise Apps
LinkLens for Confluence
How to put a Jira dependency map in a Confluence page
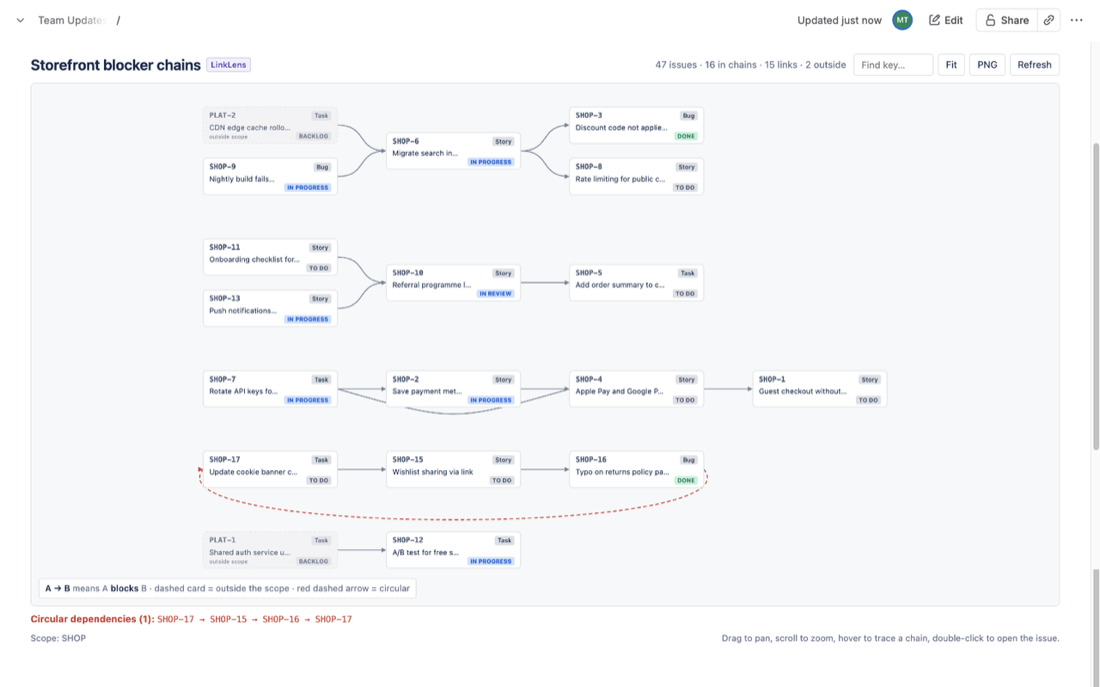
To put a Jira dependency map in a Confluence page you need something that reads Jira issue links and draws them as a graph. Confluence Cloud has no native macro that does this. The Jira Issues macro can list issues that match a link query, the Jira Timeline macro and embedded Plans show work on dates, and a draw.io or Gliffy diagram can show the chain as it was on the day someone drew it. LinkLens for Confluence adds a macro that draws every blocker chain of one link type from a project or JQL scope, live, with circular dependencies in red and linked issues from other projects shown as dimmed cards.
Why dependencies end up in Confluence
Release pages, cross-team planning pages and go/no-go checklists live in Confluence. The dependencies behind them live in Jira as issue links: blocks / is blocked by, depends on, or a custom type your site defined. Jira shows those links one issue at a time in the Linked work items section, which is fine when you already know which issue to open and useless when the question is "what is standing between us and the 2.4 release?"
A dependency map answers that question in one picture: cards for issues, arrows for links, blockers on the left and blocked work on the right, whole chains rather than single hops. Getting that picture onto the page where the release is discussed is the problem this article is about.
Native option 1: the Jira Issues macro with a link query
The Jira Issues macro ("Display Jira work items in a list" in Atlassian's documentation) renders the result of a JQL query as a live table on the page. JQL has two ways to ask about links.
- Issues linked to one issue.
issue in linkedIssues("SHOP-7", "blocks")returns the issues that SHOP-7 blocks. Atlassian's knowledge base notes that this form needs a work item key, and to cover several starting issues you repeat the function withOR. - Issues that have a link of a type. Since 2019 Jira Cloud also supports the
issueLinkTypefield, soproject = SHOP AND issueLinkType in ("blocks", "is blocked by")returns every SHOP issue that takes part in a blocking link. Atlassian closed the long-running request for this, JRACLOUD-25640, as fixed in September 2019.
Both are useful. Neither is a map. The result is a flat table: it tells you which issues are involved, not which one blocks which, and never how long the chain is. linkedIssues() goes one hop from the issue you name; the request to let it walk a link tree recursively (JRACLOUD-20104) was closed as "Won't Do". A blocker three hops upstream only shows up if you already knew to ask about it.
Native option 2: Jira Timeline and embedded Plans
Two native embeds put time-based views of Jira into a page.
The Jira Timeline macro. Paste the URL of a software space's timeline into a Confluence page, or type /timeline, and Confluence renders the timeline live. People with the right permissions can interact with it as they would in Jira. It is scoped to the timeline of one space and shows work as bars on dates.
Embedded Plans. On Jira Premium and Enterprise, you can copy the link to a saved plan view and paste it into a page as an embed. Viewers need access to the plan and the Plans viewer permission, plus permission to view the spaces and boards the plan includes.
Both are good at "when". They are weaker at "what waits on what". A timeline draws bars in date order and can show dependency lines between items on it, but a chain that crosses spaces, includes unscheduled work, or runs through issues that are not on that timeline is either partial or not shown. And Plans is a paid tier that not every team, or every reader of a release page, has.
Native option 3: draw it by hand
The most common real-world answer is a diagram. Someone opens draw.io or Gliffy in the page, draws boxes for the key issues, types in their keys, connects the arrows, and the release page finally has a dependency map.
It looks right on the day it is drawn. Then:
- Links change in Jira and the diagram does not. Someone removes a link, adds a new blocker, or moves an issue to Done. The drawing keeps the old picture until a person notices and redraws it.
- Status is typed, not read. "In progress" on a box is a label someone wrote, not the issue's status. Readers cannot tell which boxes are current.
- Nobody draws the whole scope. Hand-drawn maps show the chains someone thought were important. The fourth hop into another team's project, or the loop that quietly formed last week, is not in the picture because nobody knew it was there.
For a one-off architecture sketch that is fine. For a release page that people read every week to decide whether to ship, a stale map is worse than none, because it looks authoritative.
How to do it with LinkLens for Confluence
LinkLens for Confluence is a macro that builds the graph from Jira issue links each time the page is opened, so it cannot drift from Jira.
- Install and connect. Install the app on Confluence. A site admin then connects it to Jira on the same site once, from Manage apps. No separate Jira app is needed. Until it is connected, the macro shows "Connect LinkLens to Jira".
- Insert the macro. Edit the page, type
/LinkLensand pick LinkLens dependency graph. - Configure it. Choose a Link type (Blocks is the default; any link type on your site works, custom ones included, both directions handled). Choose a Scope: Jira projects with optional extra JQL such as
fixVersion = 2.4, or any JQL query includingfilter = 12345. Optionally turn on Hide Done issues, pick a graph height and add a title. Select Save. - Publish. The graph loads live for every reader. Refresh reloads it.
What you see on the page:
- Whole chains, left to right. Each card is an issue with its key, type, summary and a status lozenge. For Blocks, an arrow from A to B means A blocks B, so blockers sit on the left. Every chain of that link type in the scope is drawn, largest first. Issues in scope with no link of that type are counted but not drawn, which keeps the picture readable.
- Circular dependencies in red. When a chain loops back on itself (SHOP-17 blocks SHOP-15, SHOP-15 blocks SHOP-16, SHOP-16 blocks SHOP-17), the link that closes the loop is drawn as a red dashed arrow, and a Circular dependencies line under the graph lists each loop by key. Jira itself does not warn when such a loop is created.
- Cross-project ends kept in view. An issue outside the scope that is linked to one inside it, such as a platform task in another project, appears as a dimmed, dashed card marked "outside scope". The external blocker is visible even though the graph is scoped to your project. Widen the scope to follow its own links.
- Trace and open. Hover a card to light up its full upstream and downstream chain; double-click to open the issue in Jira. Find key centres the graph on an issue.
- PNG export. PNG renders the whole graph, not only the visible part, at double resolution with a legend, for slides or emails where a static copy is needed.
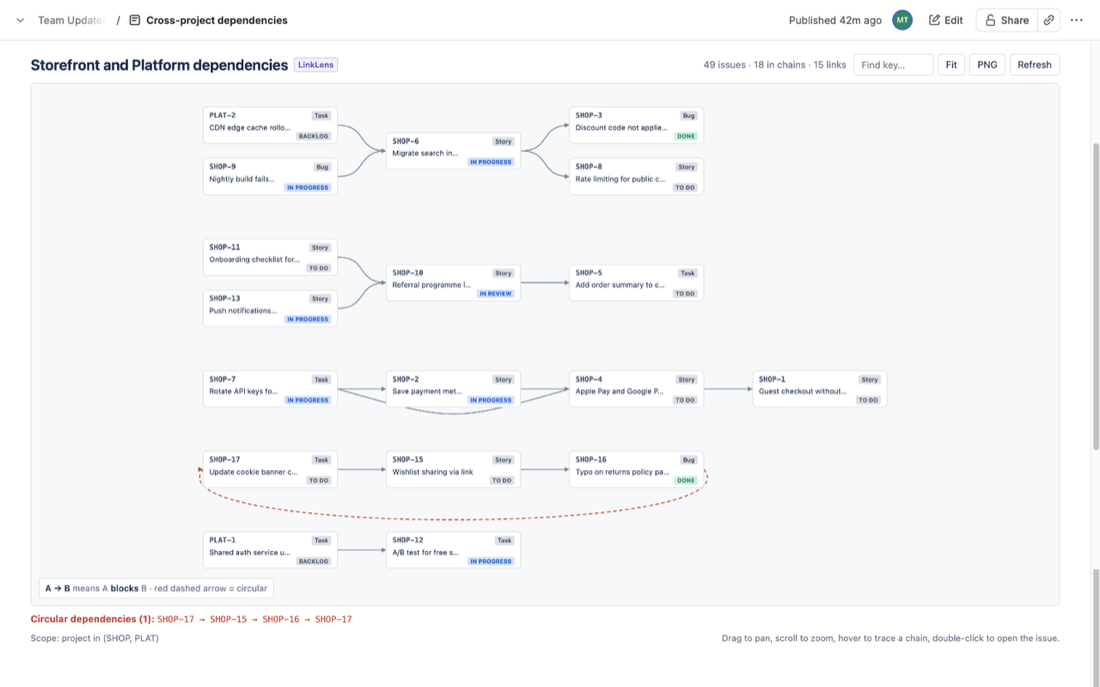
A release page can hold several graphs, one per release or one per link type. Each viewer sees the graph with their own Jira permissions; the app has a single read-only scope (read:jira-work), no backend and no storage.
What it cannot do
- Read-only. It does not create, edit or remove links. To break a loop, fix the link in Jira and select Refresh.
- One link type per macro. To compare Blocks with Depends on, put two macros on the page. Loops are detected per link type.
- One hop outside the scope. Outside-scope issues are shown, but their own links are not followed.
- Up to 2,000 issues per graph. The header says "capped" when the limit is reached.
- Hide Done and loops. With Hide Done on, a loop that passes through a finished issue is not reported.
- Same site only, and no live export. It reads the Jira on the page's own site, and Confluence PDF and Word exports do not include the live graph; use the PNG export for that.
FAQ
Which link type should I pick?
The one whose outward label means "must happen first". For most sites that is Blocks. If you use a custom type such as Depends on and the arrows look reversed, the type was defined the other way round in Jira's link settings.
Is the graph a snapshot?
No. It is built from Jira when the page opens. Use PNG when you need a point-in-time image.
Do I need LinkLens for Jira too?
No. LinkLens for Confluence connects to Jira itself. LinkLens for Jira is a separate app that adds a Dependencies page to each project and a Dependency chain panel to each issue inside Jira.
Will people without Jira access see the graph?
No. They see a "No access to Jira" message. Everyone else sees only the issues their Jira permissions allow.
What does it cost?
LinkLens for Confluence is free for sites with up to 10 users, with paid tiers above that billed by Atlassian. The Marketplace listing is pending Atlassian's approval; the LinkLens for Confluence page and the getting-started guide have the current details.
Sources
- Display Jira work items in a list, Atlassian Support - the Jira Issues macro renders JQL, filter or URL results as a list, a single item or a count.
- Retrieve Linked Work Items by Link Type in Jira Cloud, Atlassian KB -
linkedIssues()needs a work item key;issueLinkTypequeries by type. - JRACLOUD-25640, JQL function for showing all issues linked to any issue by a given issue link type - fixed in September 2019 with the
issueLinkTypeandissueLinkfields. - JRACLOUD-20104, Add a third parameter to the linkedIssues() JQL function to support recursively walking a link tree - closed as Won't Do.
- Add your timeline to a Confluence Cloud page, Atlassian Support - the Jira Timeline macro for software spaces, live and interactive.
- Share and embed your plan in Atlassian apps, Atlassian Support - embedding Plans in Confluence, Premium and Enterprise only, with the viewer permissions required.
- Link work items, Atlassian Support - link types have outward and inward descriptions.